The adapted version of the website for people with disabilities was developed by the National Statistics Office of Georgia (Geostat) with the support of the United Nations Development Program (UNDP) and the Government of Sweden.
The adapted version of the website for people with disabilities was developed by the National Statistics Office of Georgia (Geostat) with the support of the United Nations Development Program (UNDP) and the Government of Sweden.


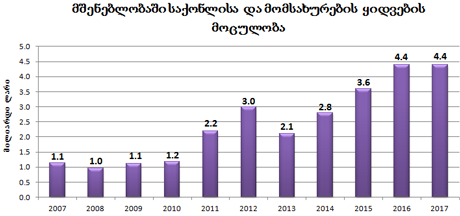
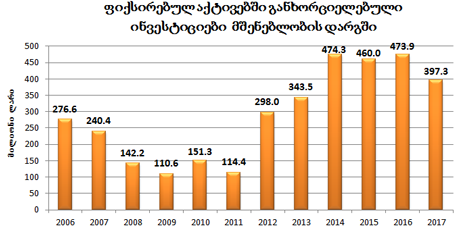
|
|
2013 | 2014 | 2015 | 2016 | 2017 | 2018 I | 2018 II | 2018 III | 2018 IV |
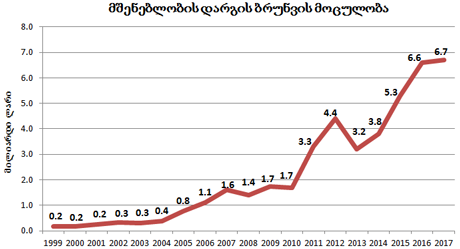
| Turnover, million GEL | 3 244.7 | 3 807.0 | 5 287.8 | 6 610.9 | 6 748.5 | 1 304.0 | 1 647.8 | 1 774.5 | 2 147.3 |
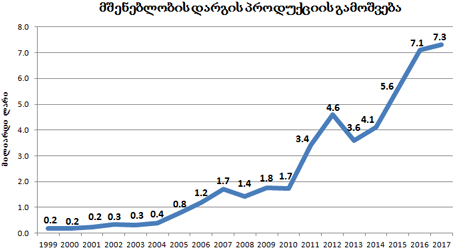
| Production value, million GEL | 3 354.4 | 4 091.3 | 5 562.1 | 7 113.3 | 7 319.3 | 1 397.2 | 1 786.7 | 1 947.0 | 2 228.5 |
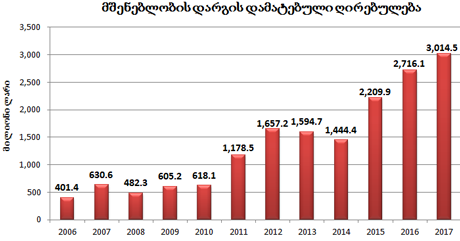
| Value added, million GEL | 1 594.7 | 1 444.4 | 2 209.9 | 2 716.1 | 3 014.5 | ... | ... | ... | ... |
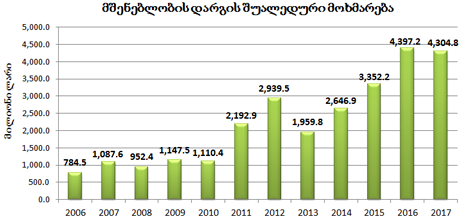
| Intermediate consumption, million GEL | 1 959.8 | 2 646.9 | 3 352.2 | 4 397.2 | 4 304.8 | ... | ... | ... | ... |
| Fixed assets, million GEL | 1 397.8 | 1 564.8 | 1 642.3 | 1 651.9 | 1 840.4 | ... | ... | ... | ... |
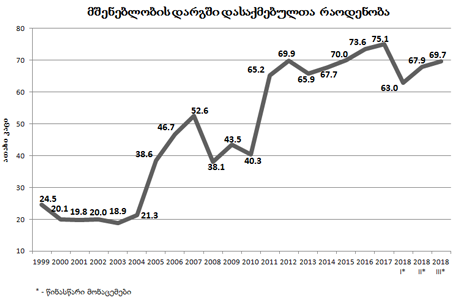
| Number of employed, persons | 65 863 | 67 698 | 69 970 | 73 648 | 75 072 | 62 966 | 67 390 | 69 739 | 70 669 |
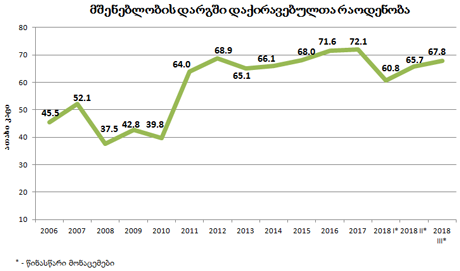
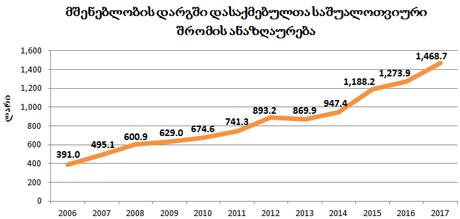
| Average monthly remuneration of employed persons, GEL | 869.9 | 947.4 | 1 188.2 | 1 273.9 | 1 468.7 | 1 552.5 | 1 760.2 | 1 732.2 | 1 952.9 |